While the Ethereum price successfully retests its important resistance level of $2,100, marketers remain highly skeptical about this altcoin breaking out of its $2,200 barrier anytime soon.
Reportedly, the Ether ETFs are constantly bleeding with an outflow streak of 13 days. During this period, the Ethereum ETF has lost over $403.64 million, highlighting a strong selling-over-buying pressure for the altcoin in the cryptocurrency market.
Despite a bullish trend pattern for the ETH price, the technical sentiments remain highly volatile and indicate a potential pullback shortly. Let us understand the possible short-term Ethereum price prediction to uncover the potential mysteries!
Ethereum Price Forms A Flag Pattern!
After successfully retesting its low of $1,930, the Ethereum price today has successfully retested its $2100 for the first time in 14 days. However, the largest altcoin has now formed a flag pattern in the hourly time frame, suggesting an increase in the bullish influence in the crypto space.
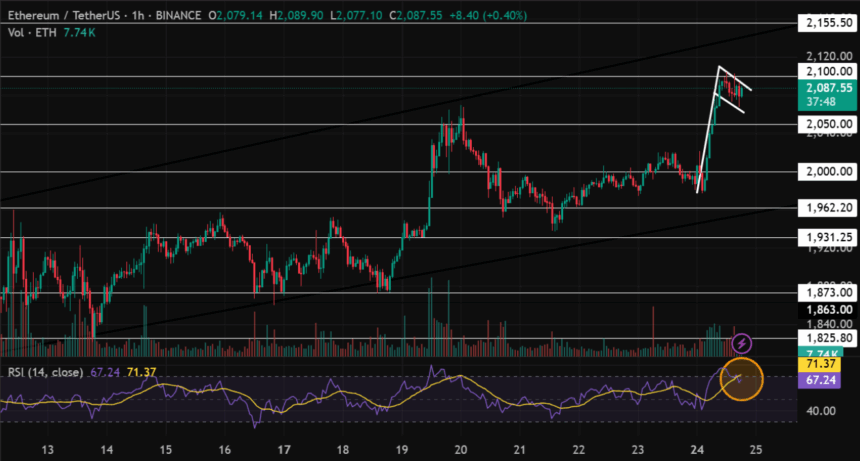
The Relative Strength Index (RSI) is extremely bullish in the 1H time frame. However, the 14-day EMA has experienced a bearish convergence around the overbought range. This suggests a significant rise in the volatility of the Ethereum price in the shorter time frame.
Is Ethereum A Good Investment?
Suppose, the market favors the bulls, in that case, the price of ETH could retest the $2,100 mark, its immediate resistance trendline. Maintaining the price above that level could set the stage for this altcoin to head toward its upper price target of $2,155 shortly.
However, a strong rejection around its resistance to flag pattern could result in it retesting its support of $2,065. Furthermore, if the bearish sentiment sustains, the Ethereum price could bleed and potentially retest its low of $2,000 this week.
Also Read: XRP and Solana Lead Crypto Inflows as Ethereum Struggles