Ethereum’s price has successfully regained momentum with a jump of over 7% today. This has resulted in the largest altcoin by market cap reclaiming its important $2,000 price mark. Following this, the altcoin market has displayed a sense of relief, with this market segment recording a notable jump over the past few hours.
However, traders are still concerned about the short-term price prospects of Ethereum as the possibility of a bearish pullback is relatively higher at this point. Moreover, questions such as “Is this a crucial time to sell your Ethereum?” are taking over the internet.
Vatalik Buterin and Justin Sun Make Major Headlines!
As per the latest reports, the developer and co-founder Ethereum, Vatalik Buterin has sold various assets to obtain a total of 71.697 ETH yesterday. This speculates the possibility of a major crypto event in the upcoming time.
On the other hand, Tron founder Justin Sun has made the headlines by staking 60,000 ETH worth ~$114 million on Lido. Following this, Justin Sun will receive 1,740 Ethereum tokens annually until his ETH holding is staked.
Moreover, the upcoming Pectra upgrade has also sparked excitement within the Ethereum community which sees greater potential for ETH price in coming months.
With this, the million-dollar question arises, should you invest in Ethereum?
ETH Price Forms An Inverted Flag Pattern!
After trading under a bearish influence for the last eight days, the price of ETH has successfully reclaimed its crucial milestone. However, ETH has now formed a failed inverted flag pattern in the daily time frame, indicating a potential reversal. A failed inverted flag pattern ideally refers to a strong positive influence in the market.
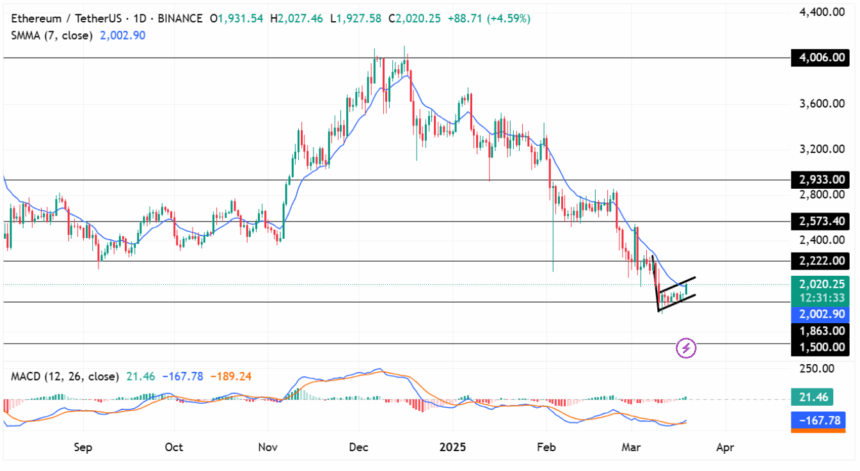
The Moving Average Convergence Divergence (MACD) shows a steady rise in its green histogram. On the other hand, the EMA 12 & 26-day records a bullish convergence in the 1D time frame.
The Simple Moving Average (SMA) is on the path of achieving a positive crossover in the Ethereum price chart. This focuses on the fact that the largest altcoin may gain momentum only if the bulls manage to break out of a potential bear trap.
Spot Ethereum ETF Records 10 Consecutive Outflow Days!
Amid the ongoing market volatility, the Ether ETF has displayed a negative flow for 10 consecutive days. During this period, BlackRock’s “ETHA” recorded the highest outflow of $124.6 million, followed by Grayscale’s “ETHE” with $117.1 million.
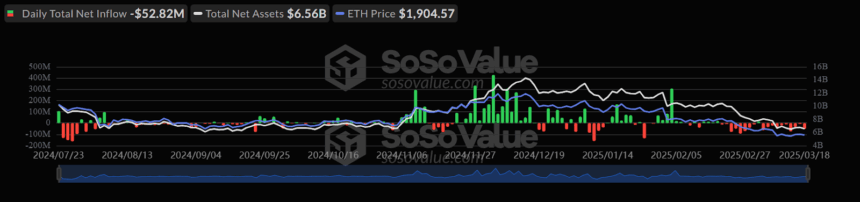
However, with the price of Ethereum reclaiming its crucial resistance level of $2,000 today and a potential increase in the bullish presence, the ETH ETF could break its negative streak and record a positive day this week.
Is Ethereum A Buy or Sell?
If the bullish momentum sustains, the ETH price could experience a breakout of its inverted flag pattern and retest its immediate resistance level of $2,200. Maintaining the price above that level could push the price of the largest altcoin toward its upper price target of $2,573 in coming days.
Conversely, if the buying pressure weakens around its important resistance zone, ETH could retest its support around the $1,950 mark. Moreover, if the bearish conditions intensify, this could result in the price of Ethereum dropping toward a new monthly low.
Also Read: Can XRP Price it $5 today? The 4 years fight with SEC ends