Bitcoin (BTC) price has climbed above the $120,000 level amid optimism in the crypto market as early “Uptober” unfolds.
As the time of writing, the largest cryptocurrency in the market is trading for $120,505, a modest 0.7% surge in 24 hours but 10.2% increase in the last 7 days, which has pushed the market cap to over $2.4 trillion.
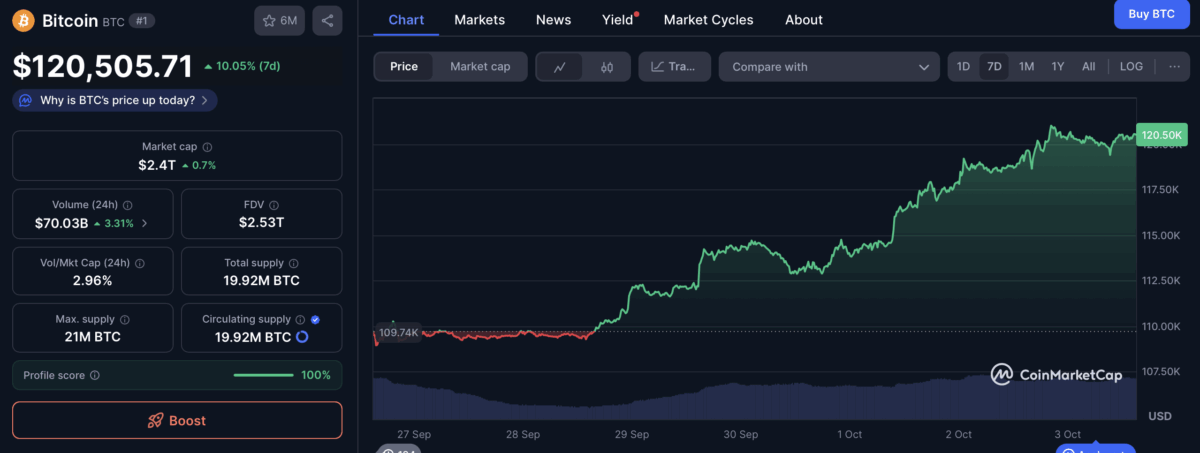
Traders have coined the term “Uptober” to describe the bullish start of the month, and many believe this is just the start. Bitcoin is expected to reach a short-term target of $124,685 to $125,071 within the next 30 days if current momentum continues. These targets are just a bit above the all-time high.
This recent rebound is fueled by mid-sized holders who have been steadily increasing their Bitcoin holdings. According to data from Glassnode, the Trend Accumulation Score for this group over the last 15 days period has surged to 0.62.
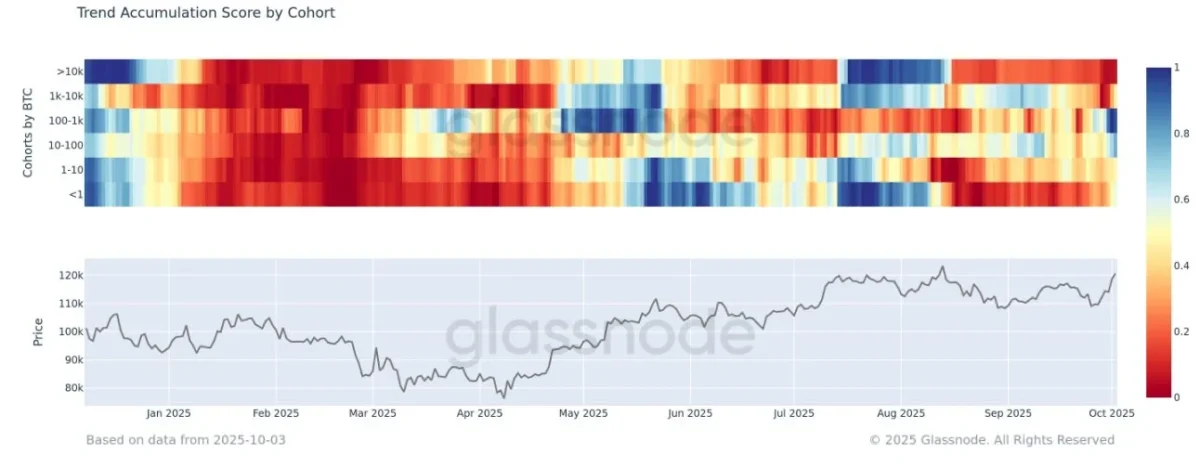
Usually, when the score is above 0.5, it shows that more investors are buying than selling, while a reading closer to 1 signals strong accumulation. Wallets holding between 100 and 1,000 BTC have shifted sharply into accumulation after selling last week. Additionally, investors holding between 10 and 100 BTC are resuming their purchases, while smaller retail investors with less than 10 BTC have reduced their selling activity.
Analyst Expect BTC to Reach $135k
Looking forward, Standard Chartered’s Global Head of Digital Assets Research, Geoff Kendrick, predicts that Bitcoin may continue climbing past $135,000 this quarter.
“Net Bitcoin ETF inflows are now at $58 billion, of which $23 billion has been in 2025. I would expect at least another $20 billion by year-end.” he said.
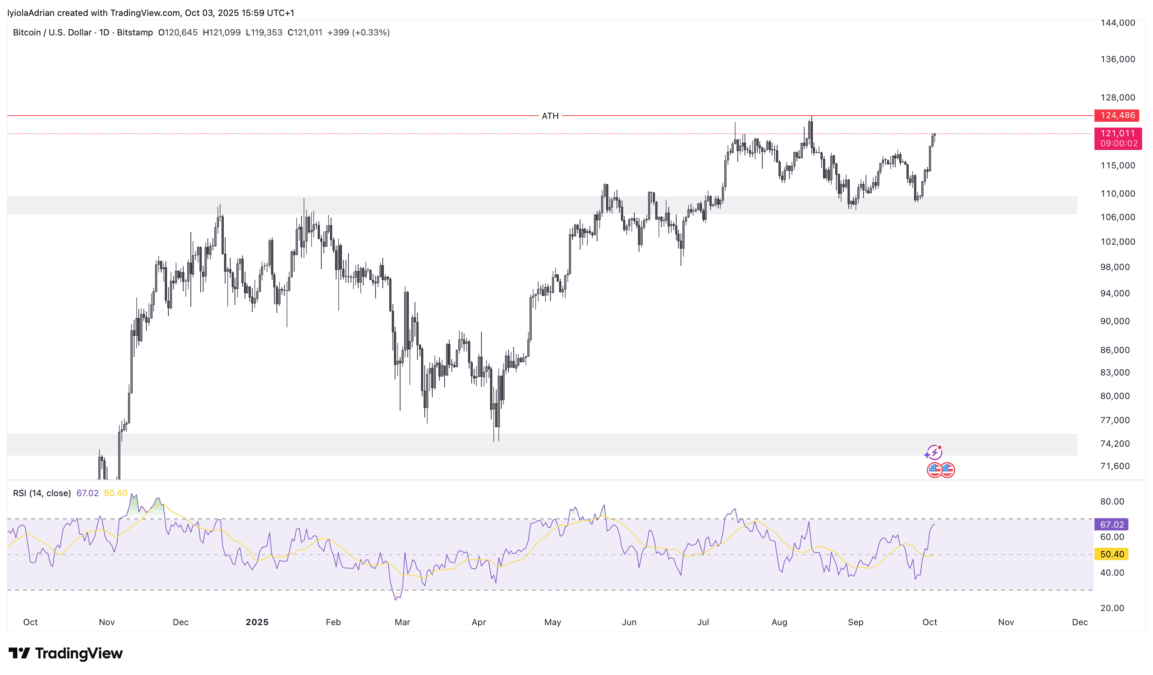
Moreover, technical analysis supports this outlook. Chart analysis shows there is an ongoing double bottom pattern, with the $108k to $110k range acting as the support where the bottom is formed. With the price currently above the $115k mark, which is the bottleneck in this scenario, it is expected to move up in this breakout range. The Relative Strength Index (RSI) stands at 66, which suggests that the bulls are still in control and that there’s still room for more push.
Also Read: MARA Adds 373 BTC in September as Holdings Pass $6B