
Amid the market downturn, Ethereum (ETH) is facing a notable selling pressure as its price hovers around $4,000. It is currently trading at $4,012 after falling 3.93% in the past 24 hours. Bitcoin (BTC), on the other hand, is trading at $111,827, down 0.64%, as per CoinMarketCap data. Besides, the global crypto market cap has slipped to $3.84 trillion, reflecting cautious sentiment.
Analyst Jason Pizzino warned on X that “ETH abnormal moves always lead to corrections of at least 20%, generally more like 30-40%. Ethereum just broke the swing low at $4050. Here comes sub $4k ETH.” His chart shows ETH often loses momentum after rapid gains, with each surge followed by a steep retracement.
Ethereum struggles with negative funding rates
Market data from Coinalyz shows that ETH has taken a hit, dropping from over $4,600 to a recent low of around $3,900. Though the price bounced back above $4,012, sentiment is still weak.
As per the chart, the aggregated funding rates have dipped into negative territory at -0.0016, indicating expectations of decline in a larger part.
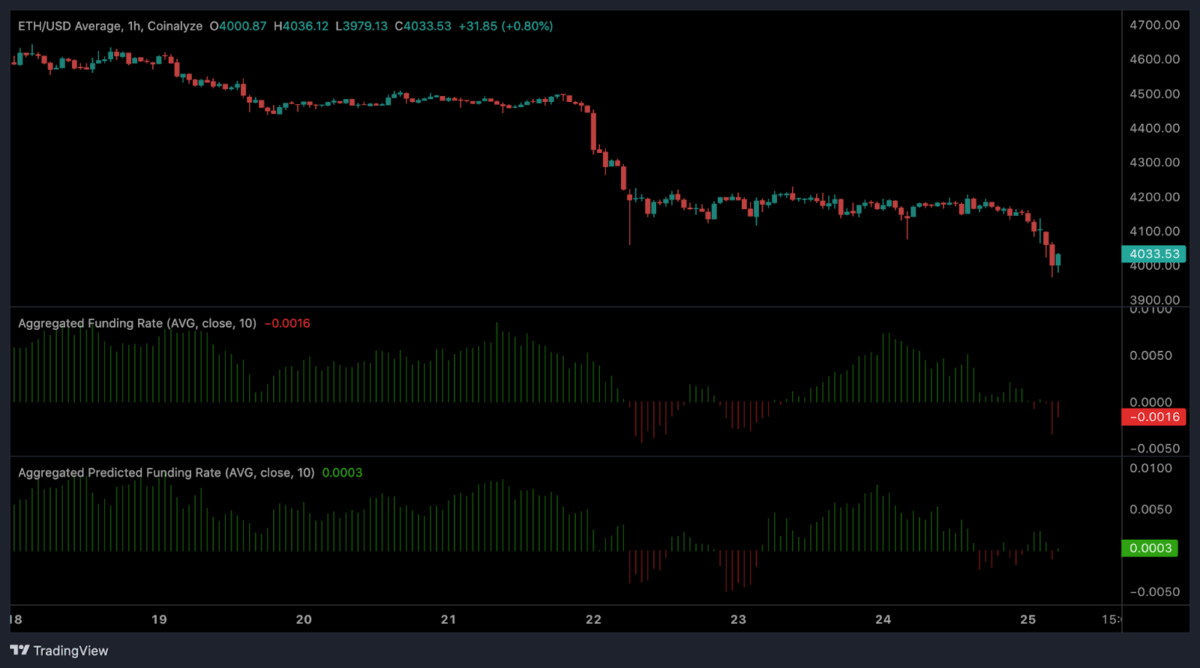
Notably, the predicted funding rate has edged up to 0.0003, showing that traders also may be anticipating a rebound or at least a pause in selling. Still, the risk of ETH falling below $4,000 is high if the bearish trend continues.
Bitcoin holds $110K amid sentiment shifts
According to TradingView data, Bitcoin has made multiple bounce-offs at the area of $111,000-$114,000 in a 4-hour timeframe. The Bollinger Bands show that BTC had just touched the lower band of $111,385, indicating it was oversold.
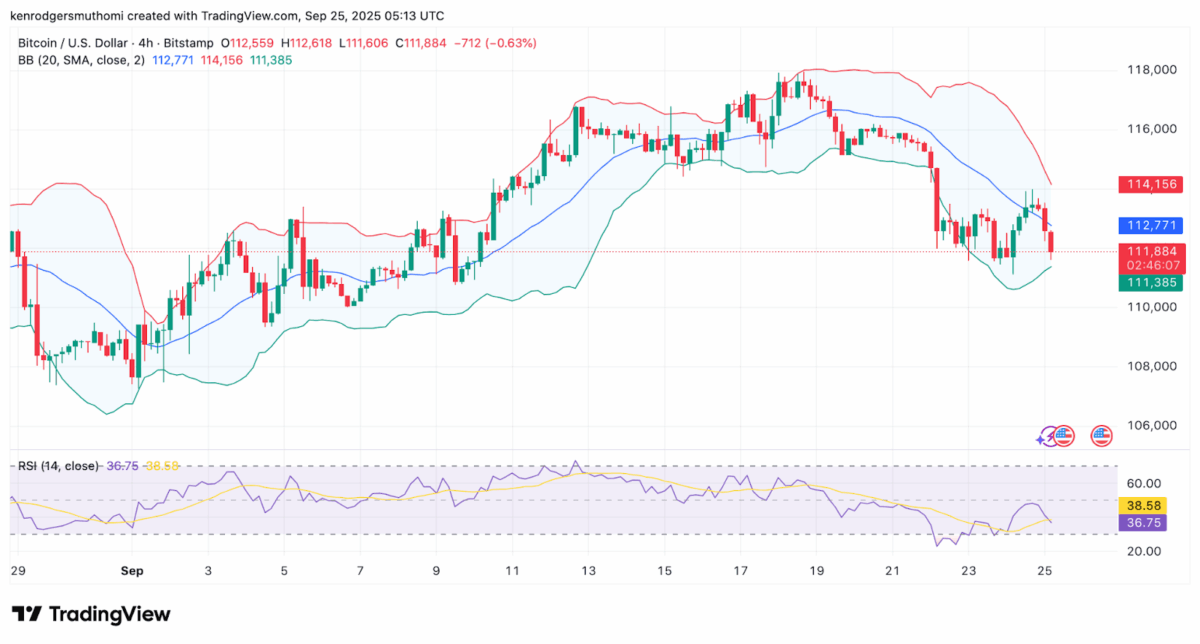
The chart further shows that attempts to recover have hit resistance levels of $112,771 and $114,156. On the other hand, the RSI is at 36.75, which points to weak buying momentum.
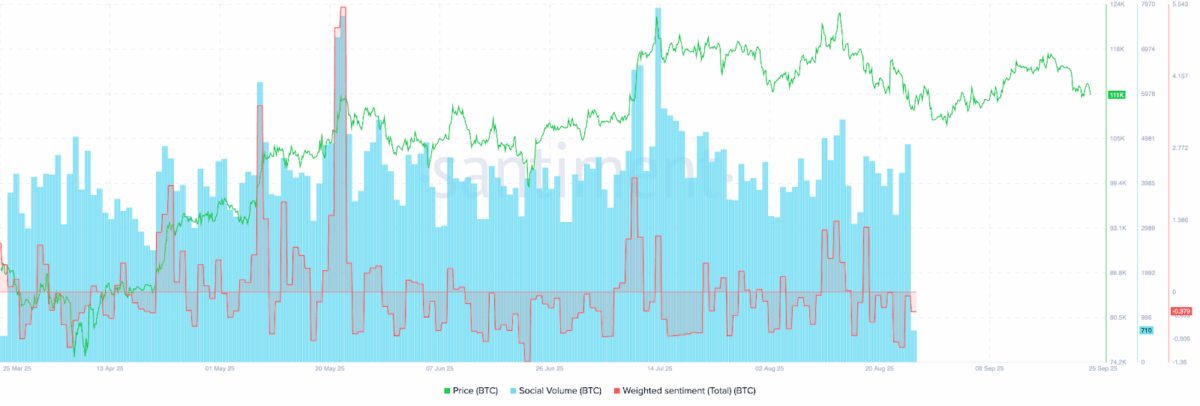
Based on Santiment data, Bitcoin’s social volume has remained high, but the overall sentiment is negative at 0.37. This kind of factor combination has historically tended to signal increased volatility and sharp corrections in the future.
Ethereum is at a tipping point near $4,000, and Bitcoin is trying to hold steady at $110,000. If either coin makes a big move up or down, it could set the direction for the entire crypto market.
Also Read: Bitcoin Drops Below Cost Basis Quantile As $107K Liquidity Trap Deepens