The Solana price is once again the talk of the town as the crypto community has witnessed a new Solana ETF filing today. As per reports, Invesco & Galaxy Digital Asset Management have applied for an Exchange Traded Fund (ETF) on SOL token.
However, the investors welcomed this filing with a Solana price drop. Notably, the SOL token has witnessed a sharp drop in its value today, raising numerous speculation among investors.
Moreover, questions like Why is SOL’s price down today? Has taken over the crypto community with storm. While some have entered into a FOMO-like state, others are actively looking for the prime cause of this situation. Let us now unwind the probability of the SOL ETF listing along with its price targets.
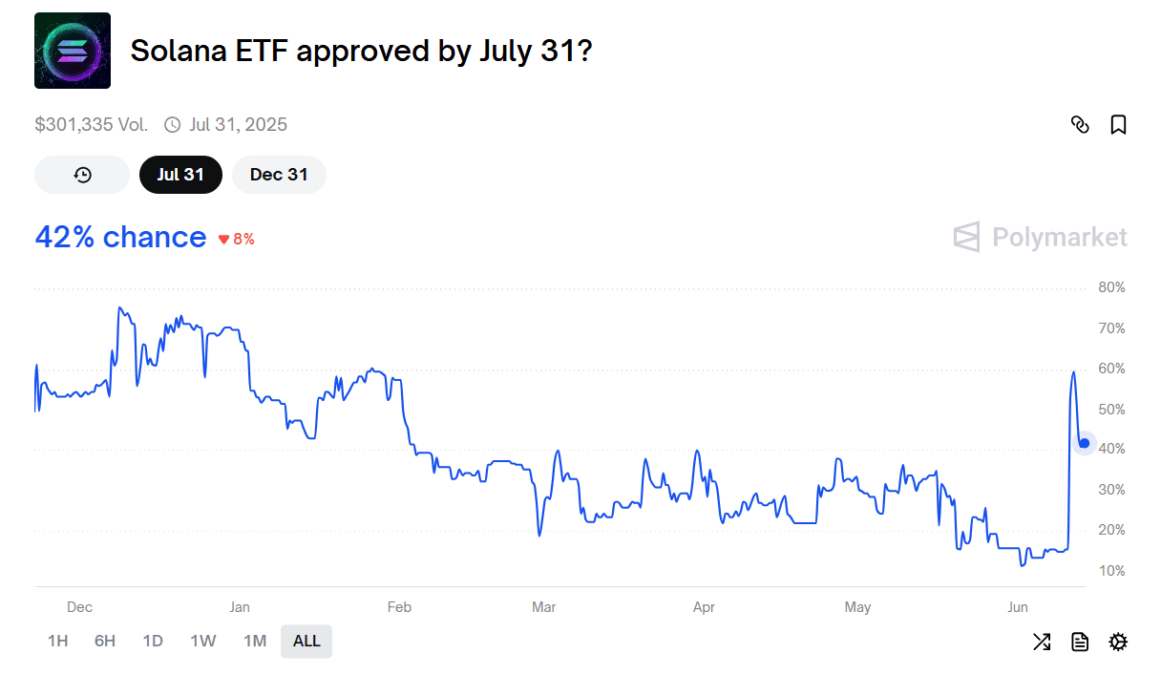
As per the latest data of Polymarket, the odds of Solana ETF approval by July 31 has dropped by 8% and is currently at 42%. This highlights reducing optimism among the investors of a potential approval anytime soon.
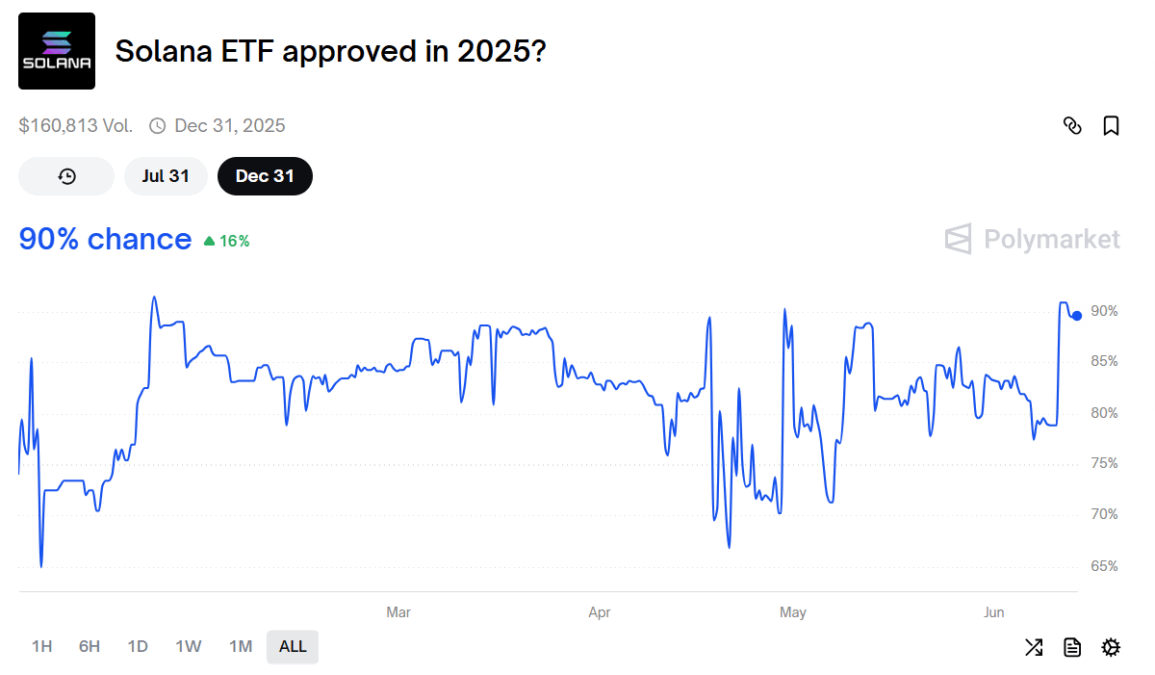
Nonetheless, the approval odds for 2025 stand at 90%, signalling a bullish outlook in the long-term. With the final deadline in the month of October, marketers showcase a strong optimism for the approval of the much-anticipated Solana ETFs this year.
Considering the market sentiments and the probability of a potential approval of Solana ETF in 2025, let us now uncover the possible short-term Solana price prediction. Despite a new filing, the SOL coin price has experienced a significant drop of 7.23% with a 68.35% surge in its trading volume to $6.45 billion. This has further resulted in it dropping below the $150 mark again this month.
However, it has recorded higher lows, resulting in it forming a strong support in the price chart. With a trading value of $147.50 it has a market cap of $77.42 billion, making it the 06th most-valued crypto project.
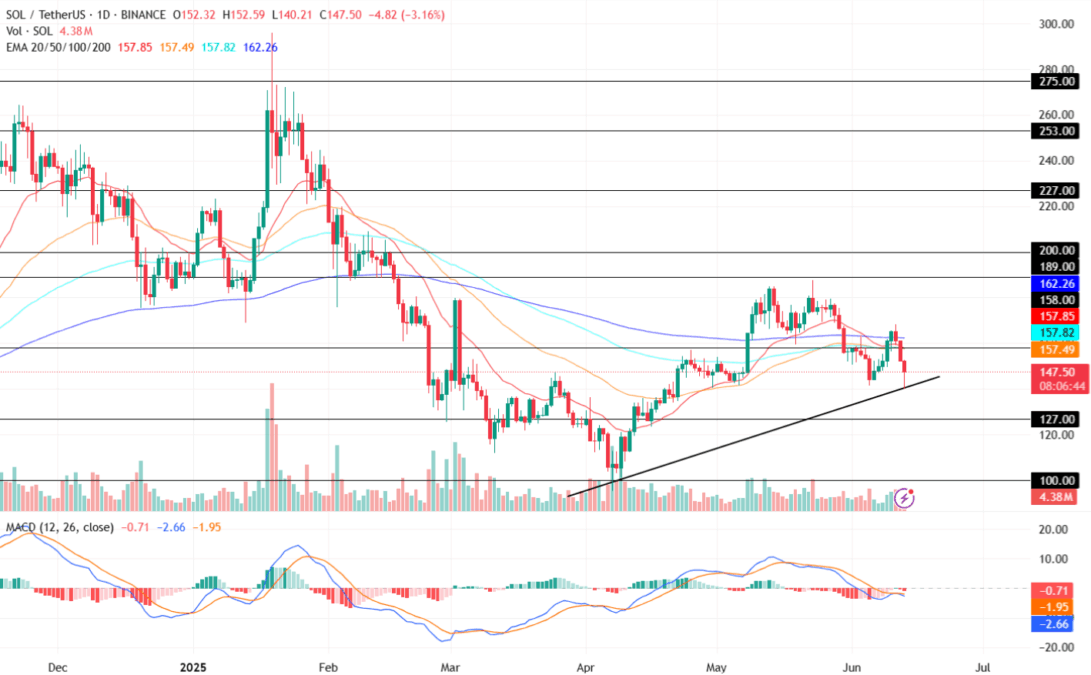
The Moving Average Convergence Divergence (MACD) indicator records a constant red histogram in the Solana price chart. Additionally, the 12 & 26-day EMA witnessed a bearish crossover in it. This type of trend generally suggests a strong negative buildup for the altcoin in the market.
The Exponential Moving Average 20, 50, 100, & 200 have all recorded a bearish convergence in the above price chart. This suggests increasing negative influence for the altcoin in the cryptocurrency market. While the 200-day EMA records a neutral action around the $162 mark, the 20, 50, & 100-day EMAs overlap between $157 and $158.
Will Solana Rise Back Up?
Suppose a bullish trend reversal occurs amid the ETF hype, the SOL crypto price could retest its immediate resistance levels of $158 and $189. Maintaining its bullish stance could push the price of Solana token toward its February 15 high of $200.
Conversely, if the liquidation increases in the market, altcoin could retest its imaginary support trendline around the $140 mark. Furthermore, if the bears outrun the bulls, the Solana price could plunge toward its lower support of $127 this month.
Also Read: BREAKING: Invesco and Galaxy Digital File for Solana ETF