Cardano (ADA) is currently going through a critical phase in its price movement. If we look at the daily chart, we see that ADA has just finished an uptrend move that pushed it to $1.31 on Dec. 3.
ADA has since entered a correction phase, which is a natural phase of its price cycle. The current price is $0.90, close to a 0.382 key level on the Fibonacci retracement.
Right now, the correction is taking the shape of a descending triangle. However, the question is whether the price is near the end of this correction.
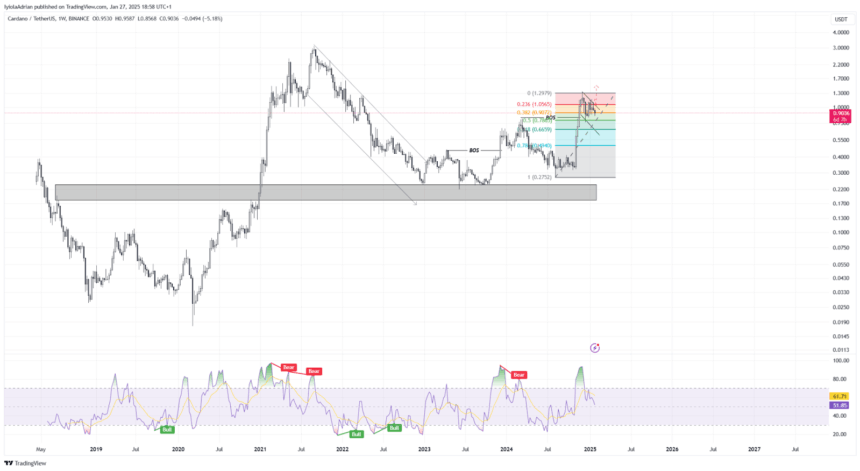
Looking at the Relative Strength Index (RSI), the line is showing a weak momentum below the 50 average level which means that the correction is almost finished.
But, ADA could possibly bottom out at around $0.70, which is another key support level. A breakout above $1.07, which represents the 0.236 Fibonacci retracement, could indicate that ADA is ready for the next uptrend move.
On the hour chart, ADA has just crossed below a support line at $1.07. The new support is currently at $0.89, and then below that is $0.81, which is a more important one.
If ADA continues to rise, it could reach $1.39 or even $1.55. There is, however, a resistance at $1.01 where the price may struggle to pass through.
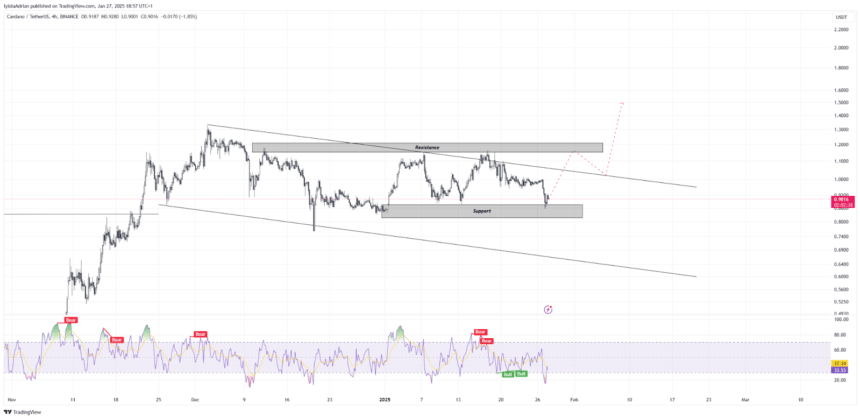
Meanwhile, the RSI on the hourly chart is reaching oversold levels, and the price can reverse soon. If an uptrend starts, the price can face resistance at $1.13 initially before heading to higher targets.
However, if the price goes below $0.81, the bullish scenario will be invalidated, indicating a bigger correction.
Also Read: XRP Crashes 11% as Market Declines, Will It Bounce Back to $3?