
The current state of the cryptocurrency market is marked by significant make-or-break moments. After a decline of approximately 18% from its peak over the past 45 days, the market now finds itself in a pivotal demand zone, setting the stage for a potential substantial recovery, which could lead the Bitcoin price to $37,000.
Upon analyzing the weekly crypto market cap, signs point to a potential upcoming rebound. The Crypto Cap is nearing the 100-week simple moving average, which notably triggered a significant shift in June 2023.
Just as in that month, a doji candle has emerged within the demand zone, possibly prompting buyers to break free from the grasp of bears.
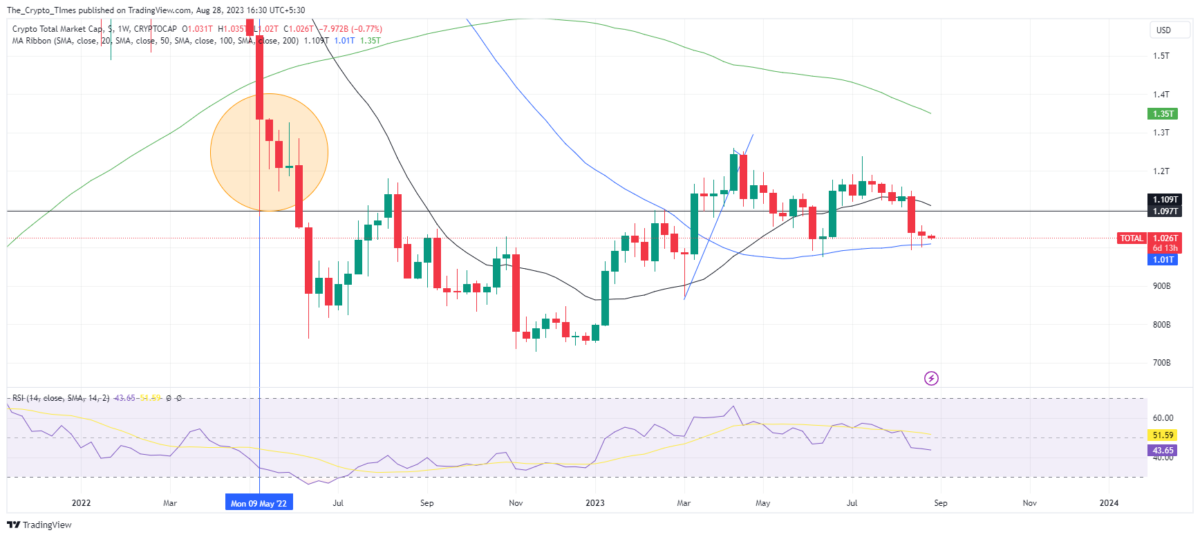
According to data from CoinMarketCap, the current Crypto Cap stands at $1.06 trillion. The notable psychological milestone of $1 trillion could potentially pave the way for a market recovery moving forward.
September Speculation: Is Bitcoin Eyeing $37,000?
As of now, Bitcoin maintains its position around the $26,000 mark, with this significant cryptocurrency staying relatively steady after a period of intense selling.
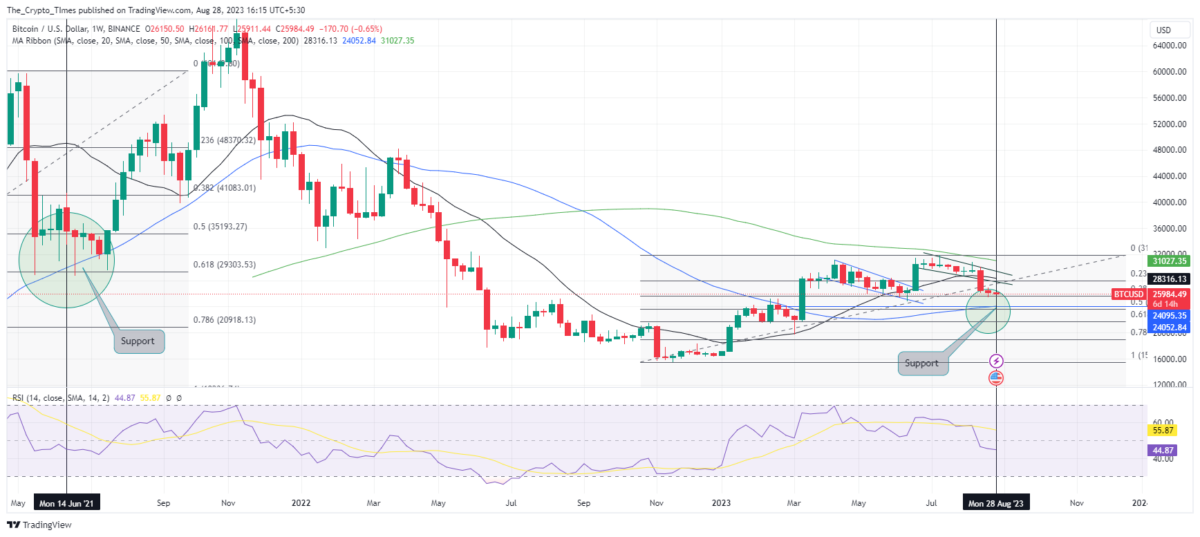
The weekly price chart highlights a significant demand area above the $25,000 threshold, aligning with the presence of the 100-week simple moving average at that level.
It’s noteworthy that back in June 2022, Bitcoin witnessed crucial support at the 100-SMA (indicated on the chart). Strikingly, a similar scenario unfolds a year later, suggesting traders might anticipate a potential rebound in September, surpassing the $25,000 mark and potentially recouping losses from the past 45 days.
Furthermore, the weekly RSI is revisiting its previous support around the 45 mark, potentially bolstering the likelihood of a September rebound in the leading cryptocurrency.
The Daily Price Puzzle: Cracking Bitcoin’s Market Moves
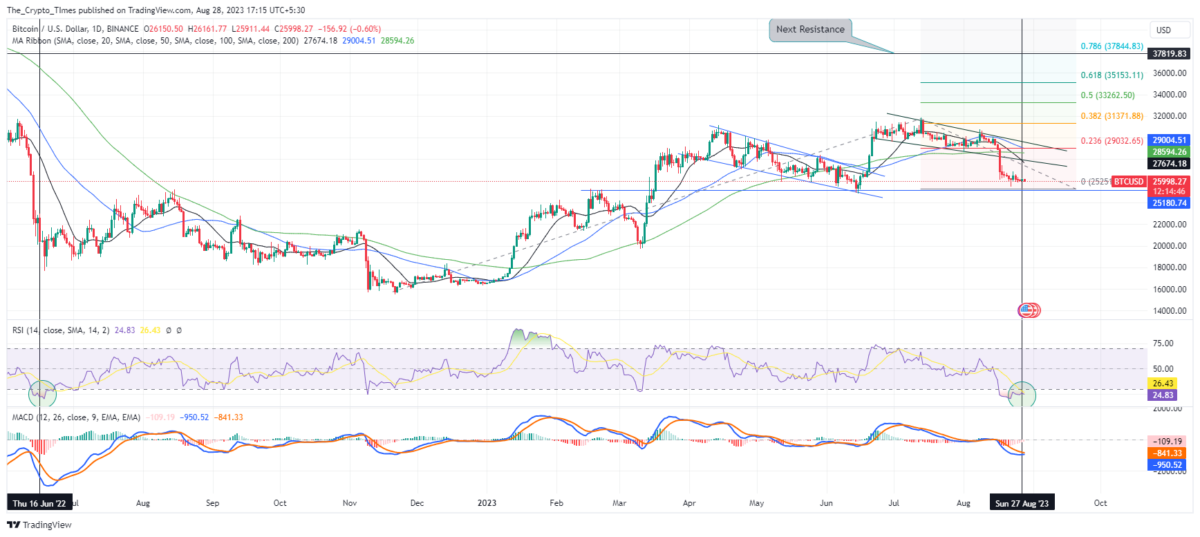
Traders have been navigating a consolidation phase above the $25,000 range for the past week. The daily RSI has resided significantly within the extreme oversold zone. Historical context reveals a similar RSI reading around 25 in June 2022 when Bitcoin hovered around the $19,000-$20,000 range. Presently, though the RSI is at 25, Bitcoin is trading at $26,000, potentially indicating a divergence that could alleviate selling pressure.
Adding to this, the MACD indicator is on the brink of a bullish crossover within negative territory. This faintly positive signal might serve as a catalyst for a swift rally toward the projected range of $37,000 to $37,800, as indicated by the Trend-based Fibonacci Extension.
Also read: Mysterious $3 Billion Bitcoin Wallet Belongs To Robinhood